Automating Browser-Based Performance Testing

Website performance directly affects the user's experience, and your business's bottom line.
One way of identifying performance issues is via API-based load testing tools such as k6. API load tests tell you whether your services scale and how quickly they respond under load, but they don’t measure the full user experience.
If you focus only on load testing your backend, you might still ship a slow or jittery site because of render‑blocking CSS/JavaScript, heavy images/fonts, main‑thread work, layout shifts, and other front-end issues.
Ultimately users don't care where the performance issue resides, they just know your site is "slow".
This slow performance can cost you customers, revenue, search visibility, and trust.
What is Lighthouse?
Lighthouse is an automated auditor built by Google and is part of the Chrome DevTools experience. While this post focuses on performance, Lighthouse also audits and provides actionable recommendations for accessibility, best practices, and SEO.
How Lighthouse works
- Launches Chrome and navigates to your page using the Chrome DevTools Protocol.
- Emulates device, network, and CPU to keep runs comparable.
- Records a performance trace and analyzes it against a set of audits.
- Outputs scores and detailed metrics with fix ideas.
- Can be included in your CI pipeline.
Core Web Vitals: what they mean and why they matter
These user‑focused metrics map to how fast content shows up, how responsive the page feels, and how stable it looks.
Core Web Vitals at a glance
| Metric | Plain meaning | Good target | What you’ll see in Lighthouse |
|---|---|---|---|
| LCP (Largest Contentful Paint) | Time to show the largest thing in the initial viewport (often the primary image or a big text block). | ≤ 2.5 s | LCP value in the Metrics section |
| FID (First Input Delay) | Delay from a user’s first tap/click to when the page can start handling it. In Lighthouse runs, use Total Blocking Time (TBT) as the responsiveness indicator. | FID ≤ 100 ms; aim for low TBT | TBT value in the Metrics section |
| CLS (Cumulative Layout Shift) | How much content unexpectedly moves while the page loads (visual stability). | ≤ 0.1 | CLS score in Metrics/Diagnostics |
Sample Lighthouse Report
Regardless of how you run Lighthouse, you get a detailed report with scores, metrics, and prioritized suggestions.
Overall scores: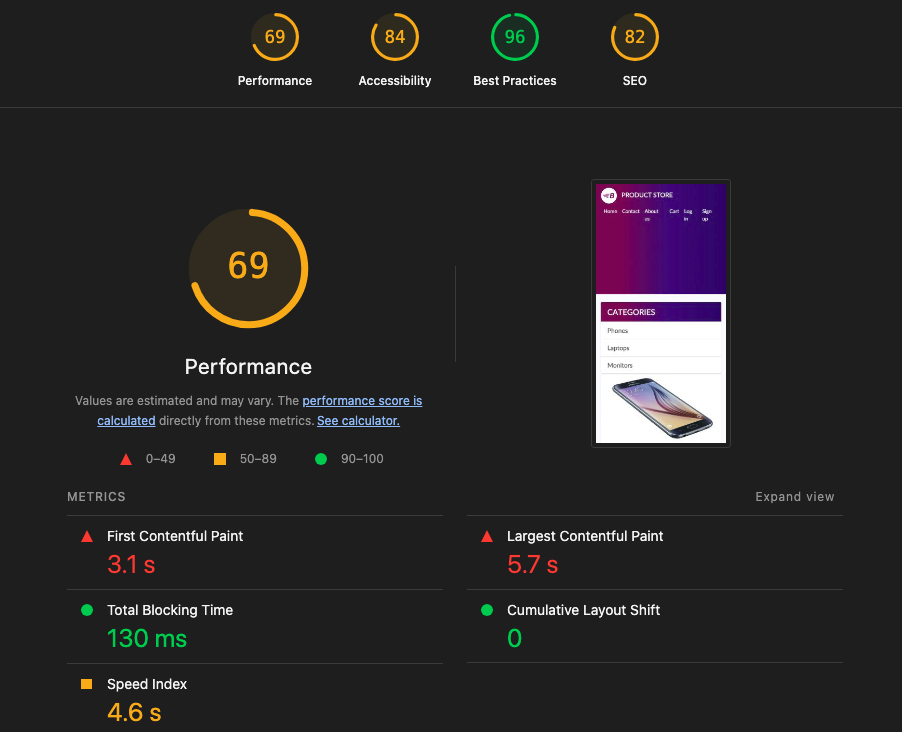
What went wrong?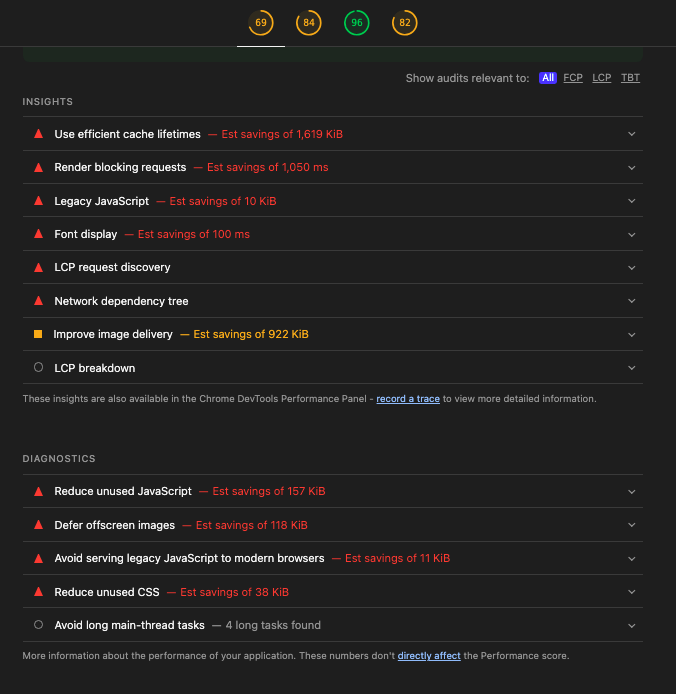
What looks good?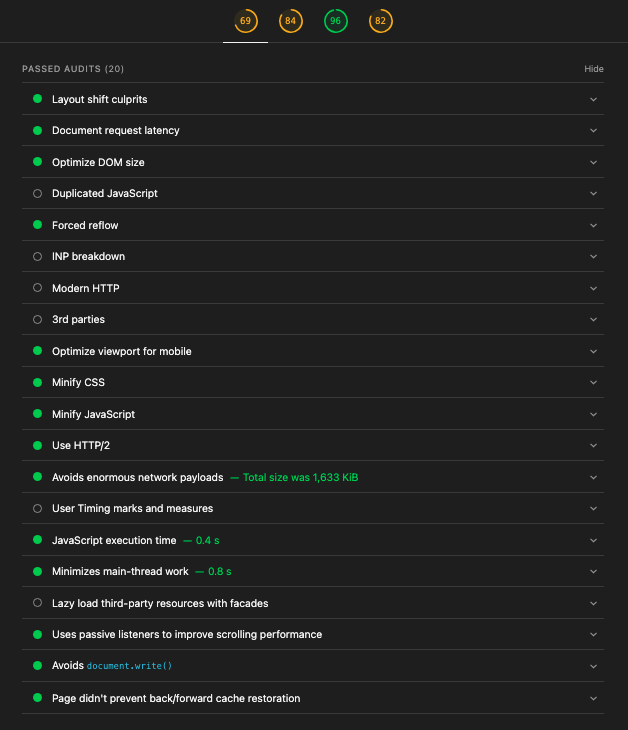
Running Lighthouse
Lighthouse can be run in a number of ways, including:
- Chrome DevTools (UI)
- Command line (CLI)
- Node module (programmatic)
Run Lighthouse from Chrome DevTools
Open your site in Chrome → Right‑click Inspect → Lighthouse tab → Set your analysis options → Analyze. This generates a full HTML report inside DevTools.
Run Lighthouse from the command line
Install Lighthouse (requires Node.js):
1npm install -g lighthouse
Basic mobile audit and open the HTML report:
1lighthouse https://www.demoblaze.com \
2  --output=html \
3  --output-path=./reports/lighthouse.html \
4  --view
Export JSON for automation or tracking:
1lighthouse https://www.demoblaze.com \
2  --output=json \
3  --output-path=./reports/lighthouse.json \
4  --chrome-flags="--headless"
Desktop profile:
1lighthouse https://www.demoblaze.com --preset=desktop --output=html --output-path=./reports/desktop.html
Use throttling to simulate slower networks:
1lighthouse https://www.demoblaze.com \
2  --throttling-method=simulate \
3  --throttling.rttMs=150 \
4  --throttling.throughputKbps=1638.4 \
5  --throttling.cpuSlowdownMultiplier=4 \
6  --output=html --output-path=./reports/consistent.html
Focus audits on key performance metrics with a config (lighthouse-config.js):
 1module.exports = {
 2  extends: 'lighthouse:default',
 3  settings: {
 4    onlyAudits: [
 5      'first-contentful-paint',
 6      'largest-contentful-paint',
 7      'cumulative-layout-shift',
 8      'total-blocking-time'
 9    ],
10    throttlingMethod: 'simulate',
11    throttling: { rttMs: 150, throughputKbps: 1638.4, cpuSlowdownMultiplier: 4 }
12  }
13};
Run with the config:
1lighthouse https://www.demoblaze.com --config-path=./lighthouse-config.js --output=html --output-path=./reports/focused.html
Programmatic usage (Node)
Why use this? Programmatic runs let you script real user interactions and measure performance along a flow (navigations, clicks, route changes). With Puppeteer + Lighthouse User Flows you can drive the browser, capture metrics per step, and generate a single report—perfect for CI, regression checks, and measuring critical journeys like signup or checkout.
Note: Lighthouse currently only supports Puppeteer for programmatic user flows.
Install packages:
1npm i lighthouse puppeteer
Save as user-flow.mjs and run with node user-flow.mjs:
 1import {writeFileSync, mkdirSync} from 'fs';
 2import puppeteer from 'puppeteer';
 3import {startFlow} from 'lighthouse';
 4
 5const browser = await puppeteer.launch({headless: 'new'});
 6const page = await browser.newPage();
 7const flow = await startFlow(page);
 8
 9// Navigate to Demoblaze
10await flow.navigate('https://www.demoblaze.com');
11
12// Interaction-initiated navigation via a callback function
13await flow.navigate(async () => {
14  await page.click('a[href="index.html"]');
15});
16
17// Start/End a navigation around a user action
18await flow.startNavigation();
19await page.click('a#cartur'); // open Cart
20await flow.endNavigation();
21
22await browser.close();
23mkdirSync('./reports', {recursive: true});
24writeFileSync('./reports/lh-flow-report.html', await flow.generateReport());
25console.log('Saved ./reports/lh-flow-report.html');
Wrap‑up
Start by running Lighthouse in DevTools (fast feedback) or the CLI (repeatable results). Focus on three things: LCP (how fast the main content shows), TBT (how responsive it feels), and CLS (how stable it looks).
What’s next in this series:
- Containerize Lighthouse runs with Docker for consistent local and CI environments
- Add Lighthouse checks to a GitHub Actions workflow with performance budgets and PR comments
- Export key metrics to Prometheus for time‑series storage
- Visualize trends and budgets in a Grafana dashboard